So here's how this effort came about: a couple of weeks ago, I was interested to know how many hours of free cooling can be extracted by data centers based on geographic locations. I had gathered data on zip codes for major concentrations of data centers around the continental US and I ran the Air Side free cooling calculations for each zip code using The Green Grid's free cooling calculator. I used a modest 72 F dry bulb and 52 F dew point as set points (yes .... you can go higher and you should).
I decided to try something new. I subtracted the number of free cooling hours from the total number of hours per year (~8760). This gave me the "Paid" hours of cooling- as one would have to spend energy to operate the mechanical compression systems in order to maintain temperature setpoints.
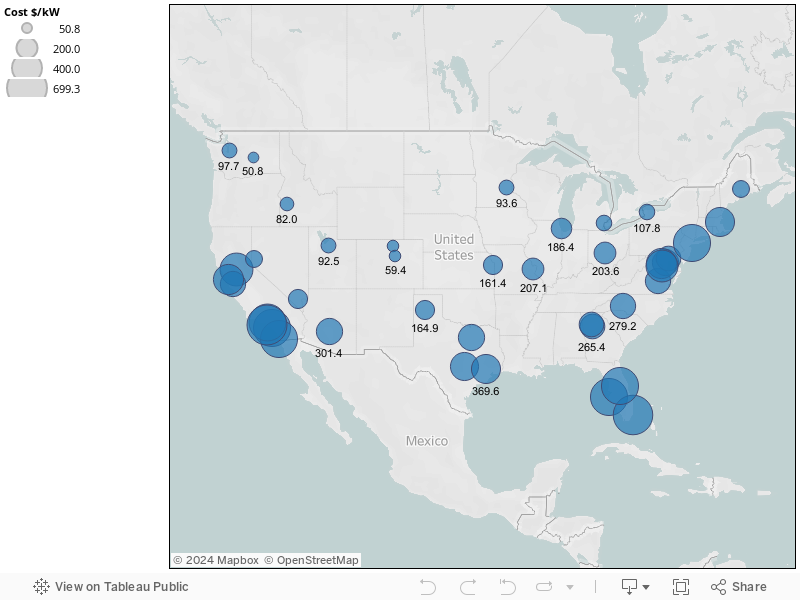
But there was still something missing. I still wanted to know what the "hurt" factor is for operating a data center in an environment that doesn't make use of free cooling. To be able to answer that, one has to look at the local electric utility rates. Some utilities in northern locations charge more than utilities in the deep south. So while the southern data centers may not benefit from free cooling, they are getting a excellent break in electric utility rates. Therefore the product of paid cooling hours and the local utility rates should give a decent idea of how much it "hurts" to operate the data center in non-desirable geographic locations and non-desirable electric utility rate jurisdictions.

Some of the observations that caught my attention:
- The least hurt factors occur in the Pacific Northwest and the Rocky Mountain States. Hence it makes sense why major data centers are concentrating in those States.
- California and Florida have approximately the same hurt factor. “Ouch”! Considering California benefits from so many hours of free cooling.
- Texas ranks a lot better than either California or Florida because their utilities rates are very competitive.
- The Mid-Atlantic States suffer from higher rates and "less" free cooling hours.
- Virginia benefits from very competitive utility rates and hence evens-out the less number of free cooling hours (compared with northern latitudes).
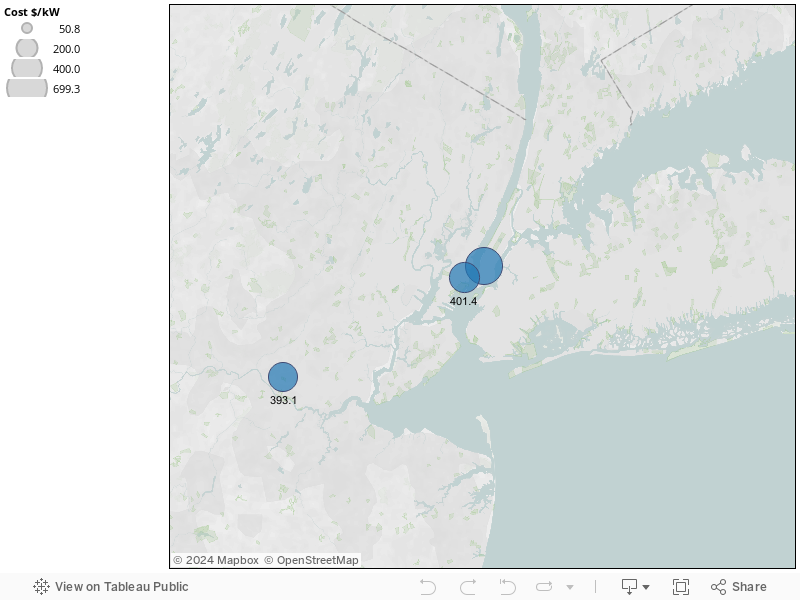
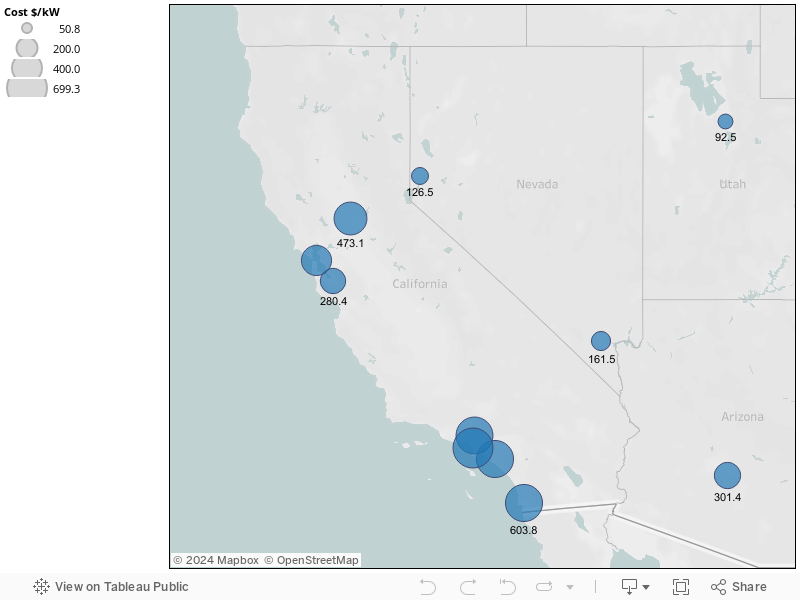
Some readers asked questions about specific locations, which I thought were very worthy of mentioning. So I'm adding images of a few more locations in New Jersey where rates are cheaper than New York. I'm also adding maps with more detail of the NY/NJ and California areas.
I could go on with observations but in summary, I like the results that I charted. I think it's a unique way to look at data and I plan to fine tune it with more accurate electric utility rates and higher temperature setpoints. I also want to look at locking out humidification and investigate water side cooling in the settings in the Green Grid's free cooling calculator-something I did not have the luxury to modify during this exercise. email if you would like me to share the utility rates separately with you.
In Australia we do it different
ReplyDeleteWe have free cooling (passive air cooling) and free cooling (assisted air cooling from water and air).
We generate our own power on site from renewable sources so no need for connection to utility.
Not only do we have no power costs for our 12 MW centres but they also generate a substantial income stream from the by product of power generation: Carbon offsets and milk, cheese, butter.
Shane, how do you plan on protecting the equipment inside the data centre from a combination of humidity and gaseous particulates that you are going to create as a result of burning gas on site? Maybe that doesn't matter because the IT equipment is owned by the end customer and the failures will not be able to be specifically associated with the design of the data centre even though the evidence might suggest otherwise.
DeleteThanks for sharing Shane. Good info.
ReplyDeleteAwesome analysis, I like it a lot. I have one question: Is the kW you used to normalize the data the IT critical load or the entire facility load?
ReplyDeleteThank Dan. The assumption is total facility kW load.
ReplyDeleteThanks for sharing good info and makes you think. I noticed for Santa Clara you had only 5895 hours of free cooling. When using the green grid calculator this condition only happens when you check the "Allow Mixing of Supply and Return Air" , why did you select that option. It seems to penalize the outcome
ReplyDeleteDavid, thanks for the comment and apologies for not getting back to you earlier. Item is checked off for better humidity control of the supply air stream. Kept all data checked off hence apples to apples comparison.
ReplyDelete